
An animated Gross Margin vs Sales scatterplot for an imaginary retail company over a period of years. This gif was made using the animation packages in R and ImageMagick.

A Spatial Mapping of sales of an imaginary retail company in various areas of Bangalore. Spatial mapping was created using ggmap in R (citation appears below)
D. Kahle and H. Wickham. ggmap: Spatial Visualization with ggplot2. The R Journal,
5(1), 144-161. URL http://journal.r-project.org/archive/2013-1/kahle-wickham.pdf
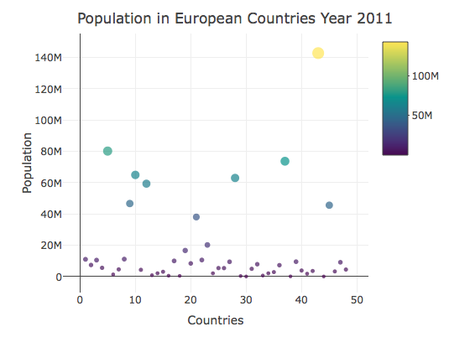
A chart of European Countries versus their populations in 2011. The chart was made using plotly in R (Rstudio). Data was sourced from the Eurostat website.